Risk Management
Objective: Gain an understanding of Risk Management Configuration and Reporting Outputs.
Risk management comprises of activities to assess, mitigate (to acceptable levels) and monitor risks.
According to ISO 31000:2009 (Risk Management Principles and Guidelines Standard), the process of risk management includes the establishment of the context or assessment base, the identification of potential risks and the assessment and treatment of identified risks.
The formal definition of risk assessment is: a systematic process for describing and quantifying the risks associated with hazardous substances, processes, action or events. From an asset management perspective, risk assessment is the process of identifying potential hazards and evaluating the risk that they pose.
ISO 55002:2014 (Asset Management Standard) requires that organisations implement actions to address risks and opportunities associated with managing the assets by establishing processes for:
- Identification of risks and opportunities;
- Assessment of risks and opportunities; and
- Implementation of the appropriate treatment and monitoring of risks and opportunities.
There are many different approaches that organisations can take in relation to risk management. The following provides a list of some these methods.
|
Method |
Description |
|---|---|
|
Assumption Analysis |
The process of reviewing all assumptions for any uncertainty that could generate risks. |
|
Expert Interviews |
Speaking with experts in order to generate risks and/or assess risk probability/impact. |
|
Crawford Slip |
A group risk identification technique. Useful in generating a large number of risks in a short amount of time. |
|
SWOT Analysis |
Strengths, Weaknesses, Opportunities, & Threats. A risk identification technique used to help generate risks and place them into categories. |
|
Risk Breakdown Structures |
A formal coding of risks that can supplement the risk register and explore the relationships of different risks to each other. It can be helpful for an agency when organizing similar risks across multiple projects. |
|
Likelihood and Consequence Matrix |
Qualitative analysis tool to provide a ranking of risks based on probability and impact. It is a powerful visual tool to convey risk ranking. |
|
Monte Carlo Analysis |
A risk analysis modelling method that uses repeated trials computing probabilistic outcomes of various risk events or uncertainties. The technique is used for both cost and schedule. |
|
Risk Priority Ranking |
Using qualitative or quantitative analysis methods to rank risks. This often results in a dynamic “Top Ten” list to track risks with the highest potential impact at any given project development phase. |
|
Risk Map |
A tool that places all risks graphically on a probability and impact (P x I) matrix to show relative probability and impact of different costs. Can also show how mitigation changes the probability and impact of each risk. |
|
Risk Register |
A risk management tool that lists risks in a given project and provides summary information that can include the risk description, probability, impact, ranking, ownership, and other important information. |
|
Contingency – Identified |
The process of estimating contingency on the basis of identified risks and the probability of their occurrence. |
|
Contingency – Percentage |
The process of estimating contingency based on a percent of the project. The percentage is typically based on policy, similar projects, or estimator judgment. |
When it comes to managing infrastructure assets, decisions with respect to which assets are upgraded or renewed are typically constrained based on the funding that an organisation has available. This funding needs to be allocated to capital and maintenance activities to achieve and deliver the target levels of service that have been agreed upon by the organisation.
Predictor utilises genetic algorithm optimisation techniques and cost/benefit analysis to select the most appropriate mix of project candidates, which will keep the asset network at the highest possible service states, when funding is constrained.
Assetic’s Predictor risk module utilises the likelihood and consequence method, which is a qualitative analysis method that provides a ranking of risks based on their probability and impact.
With the introduction of the new risk feature, Predictor can now utilise asset risk during the selection of the project candidates. This feature ensures that not only will the selected project candidates maintain the asset network at the highest possible service states, but also ensures that the project candidates selected are the most important to the organisations network, thereby mitigating the risk. In addition to modelling the future predicted service states of your assets, you can now model the likely risk impacts to your organisation and view these results in pre-defined Predictor reports.
Configuring Risk in Predictor
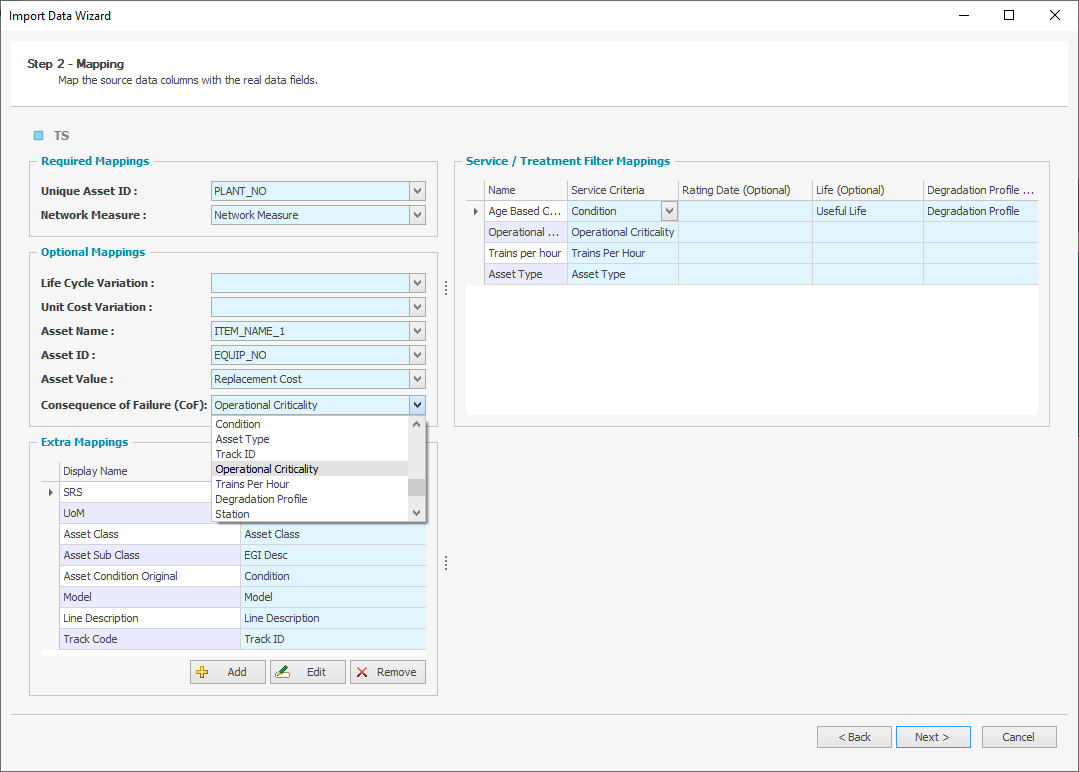
Prior to configuring your Risk Framework, located in the Advanced Setup tab within the Template, you must first map your Consequence of Failure (CoF) values during your data import. This is an optional mapping requirement and is an essential step if you wish to model risk and view the pre-defined risk reports.
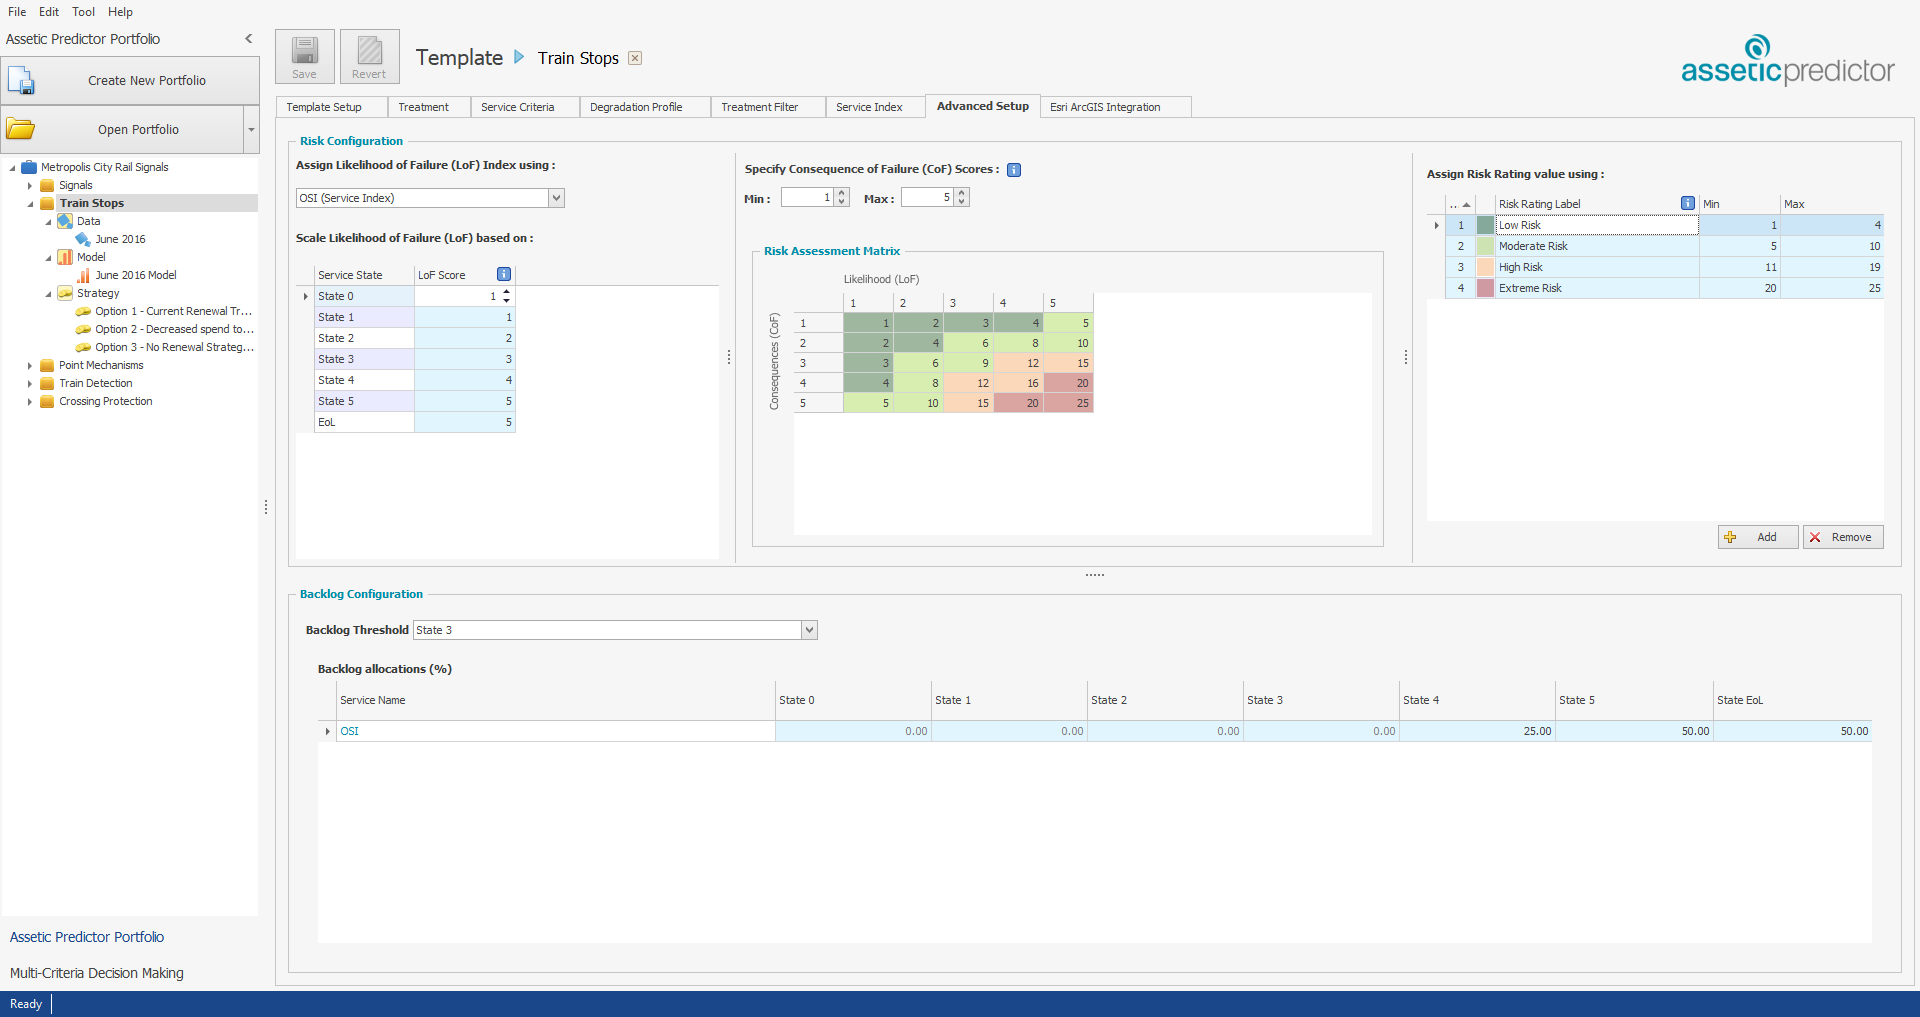
After the data has been imported with the CoF values, the Risk Configuration can be located in the Advanced Setup tab within the Template.
The Consequence of Failure (CoF) values are considered static values and are generally assigned to each asset depending on one or a combination of the asset type, function, location, criticality etc.
An example is provided below for CoF assessment scoring.
Example: A Consequence of Failure value of 1 may indicate that should an event occur, that it will be insignificant to the organisation. Alternately, a value of 5 indicates that a risk event of this magnitude will have catastrophic consequences (the higher the number, the more severe the consequence).
|
Description |
Consequence of Failure Rating |
|
Catastrophic |
5 |
|
Major |
4 |
|
Moderate |
3 |
|
Minor |
2 |
|
Insignificant |
1 |
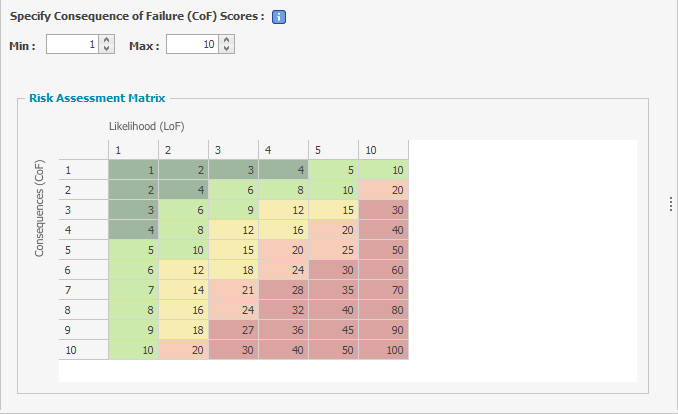
The CoF can be either a quantitative or qualitative assessment. Specify the numerical values adopted by your organisation which represent the CoF should an event occur.
This requires a Min and Max Score assigned to each asset within your dataset.
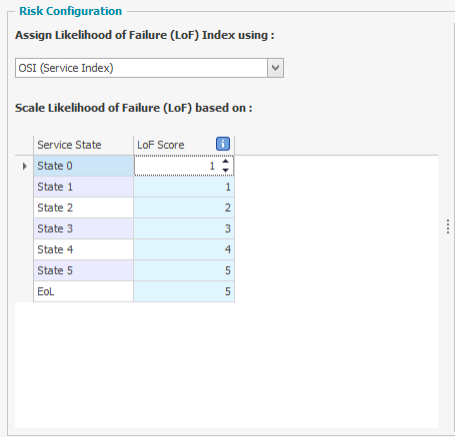
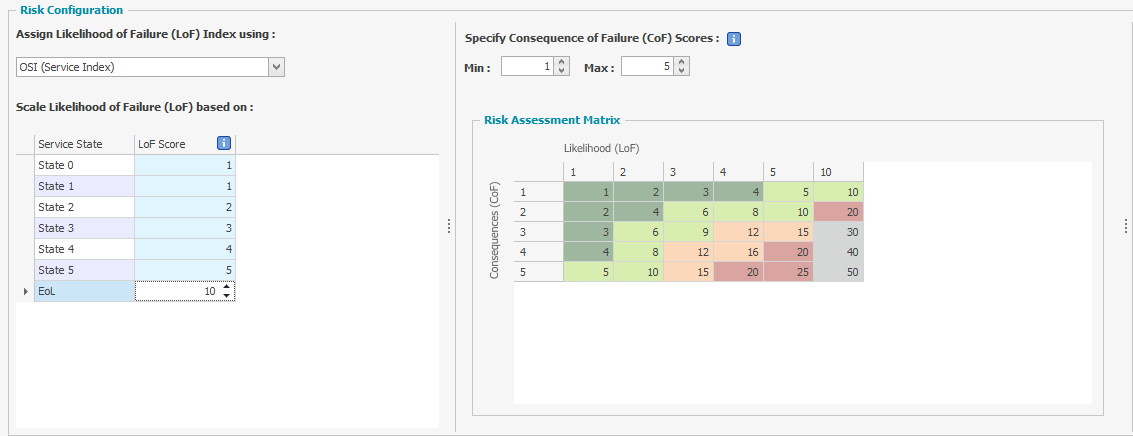
The Likelihood of Failure (LoF) is a qualitative assessment based on your organisation's risk framework. Predictor utilises the assets’ service state (represented by any of the available Service Indices) to represent the likelihood (or probability) that a risk event will occur when an asset is in that service state. This is represented as an integer value.
Example: Select the Service Index that represents the Likelihood of Failure (LoF) scoring value and assign an integer value to each LoF rating.
|
Description |
Likelihood of Failure Rating |
|
Almost Certain |
5 |
|
Likely |
4 |
|
Possible |
3 |
|
Unlikely |
2 |
|
Rare |
1 |
In the below example, State 0 and State 1 are assigned a value of 1 that indicates that it would be rare for a risk event to occur when the asset is in excellent condition. State 5 and EoL are assigned a value of 5 which represents that it is almost certain that a risk event would occur when an asset is nearing the end of its useful life.
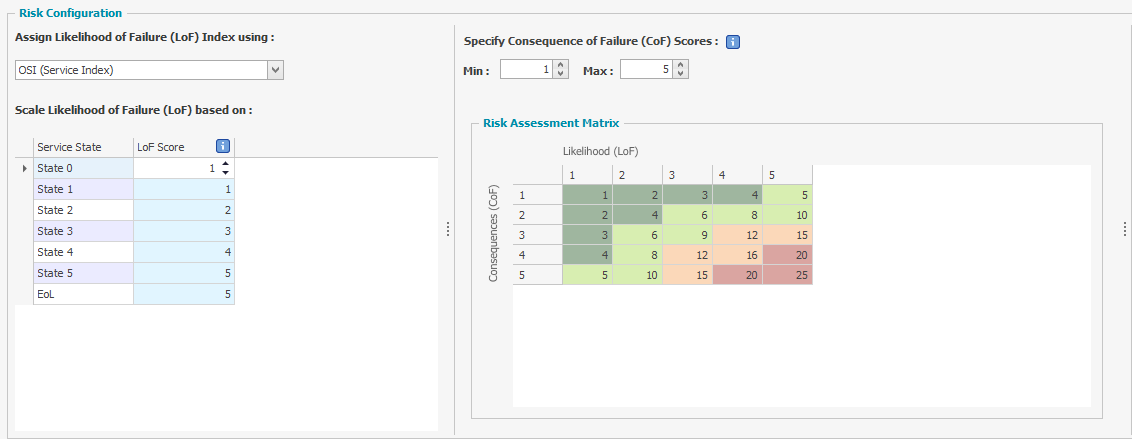
As the LoF values range between 1 to 5, and the CoF values also range between a min value of 1 and max value of 5, that the corresponding Risk Assessment Matrix is currently represented as a 5 by 5 matrix.
If the LoF values are updated to a 1 to 10 range, as per the following example, the matrix will update to reflect the change in scale.
Similarly, by increasing the CoF Max Value from 5 to 10, the matrix expands to reflect the change in scale.
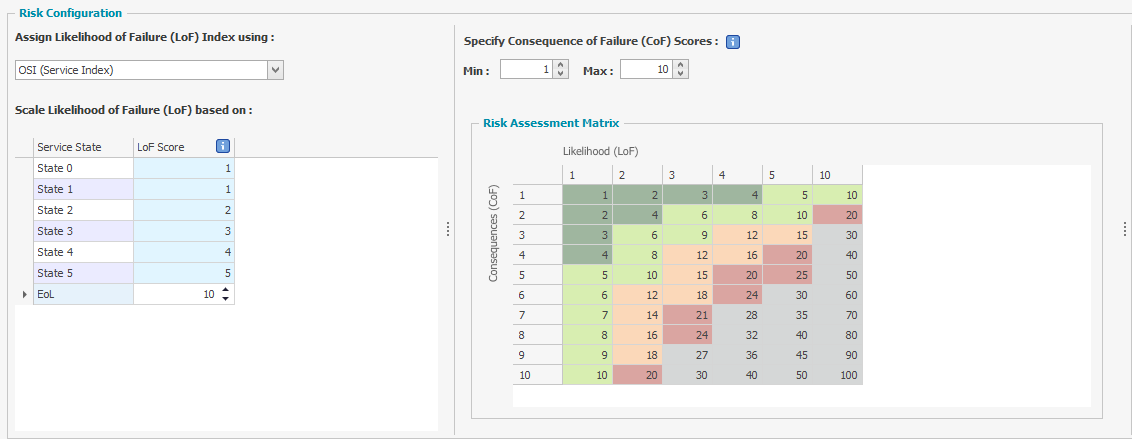
The minimum number of CoF rows is 2 and the maximum is 25.
Predictor calculates the risk score from the assigned imported CoF values multiplied by the predicted LoF values.
The colouring of each cell is represented from the assigned Risk Min and Max values from the Risk Rating Table on the right-hand side of the Risk Configuration window. The above example has grey cells as it indicates that these risk scores have no matching scaling defined within the Risk Rating table. Currently, the minimum value is 1 and the maximum value is 25.
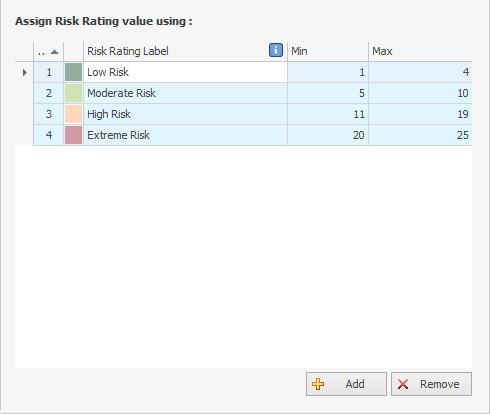
If additional labels are added, or updates are made to the Min and Max values of existing labels, this will be reflected in the Risk Assessment Matrix.
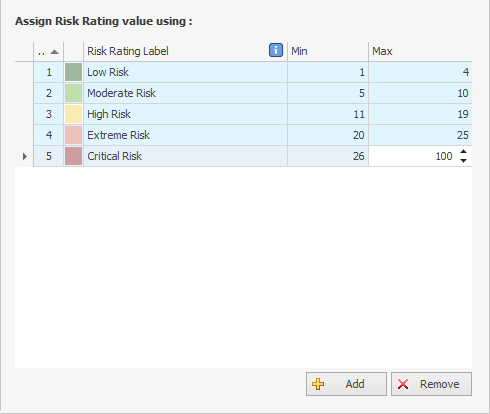
As a result of these changes, all values within the Risk Assessment Matrix are now allocated a risk rating and there are no longer any grey cells visible.
The Risk Rating table is a useful qualitative analysis tool that provides a ranking of risks using the likelihood and consequence matrix. It is a powerful visual tool to convey risk rankings for your organisation. Up to 10 user-specific risk rating labels can be assigned to represent the minimum and maximum risk scores of your organisation's risk appetite.
The predicted risk impacts, based on your risk modelling parameters, are visible within the pre-defined Predictor reports once a Simulation is created.
Using Risk to Optimise
If you would like Predictor to utilise risk during the optimisation phase, you will need to define the risk parameter benefits in the Benefit Variation Tab located within each Strategy.
The default configuration is blank.
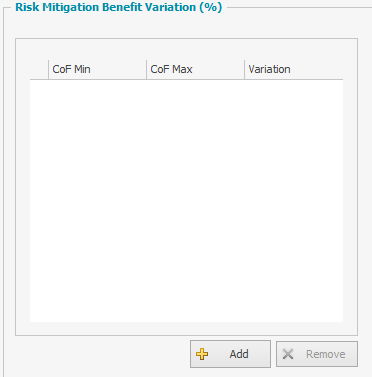
Select ‘Add’ and define the minimum and maximum Consequence of Failure values, along with the percentage variation.
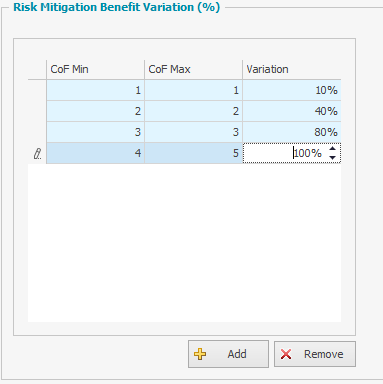
Predictor will now utilise risk as a parameter during the optimisation and selection of project candidates.
